First Steps
You can consult the help of each function/class/method on this website.
Quick examples of the use of the functions/classes are shown to highlight some of the possibilities offered by Rampy.
Example Jupyter notebooks are also shown, and can be dowloaded
Library importation
Python does not come with a lot of possibilities. This is why you usually need to import a few libraries. You can assign a shortname to a library, as usually people import/use functions with libraries’ prefix, to avoid confusion (two libraries can have a function with the same name…). A useful shortname for rampy is rp:
# importing rampy
import rampy as rp
# and for numpy we will respect the usual name:
import numpy as np
# for matplotlib
import matplotlib.pyplot as plt
Data importation
This is done using directly Pandas or numpy, except for:
importing multiple spectra can be done with the
rampy.spectrarray()function;maps for which rampy provides a function to import the CSV files generated by
the Renishaw or Horiba Raman spectrometers.
To import a spectrum saved in a 2 column text file “data.txt” with space separator, we can use the numpy genfromtxt function:
import numpy as np
spectrum = np.genfromtxt("data.txt")
If our file has a 10 line header, we can skip it like
spectrum = np.genfromtxt("data.txt", skip_header=10)
See the documentation of numpy for further details, as well as that of Pandas.
Plot a spectrum
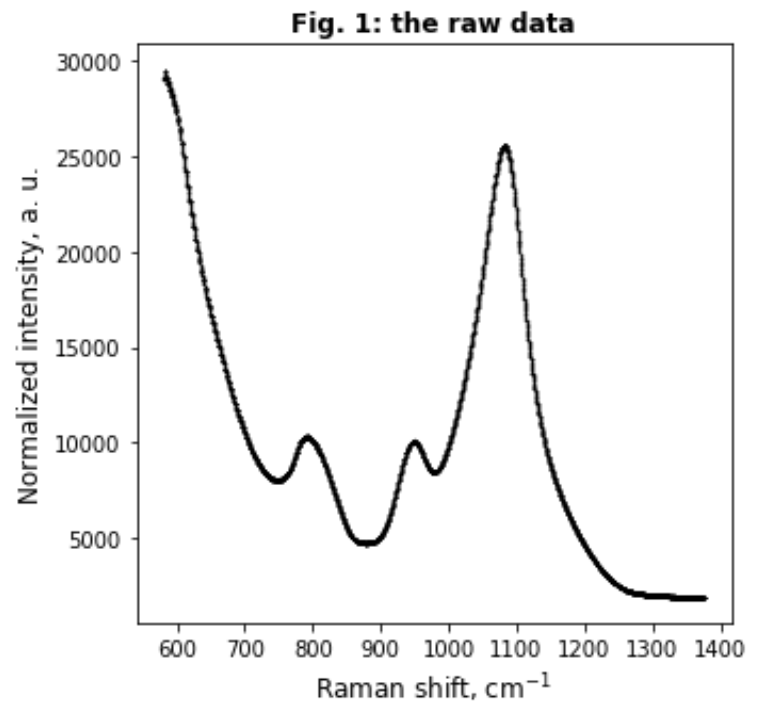
This can be done with Matplotlib directly. For instance, to plot our spectrum we can do:
plt.figure(figsize=(5,5))
plt.plot(spectrum[:,0],spectrum[:,1],'k.',markersize=1)
plt.xlabel("Raman shift, cm$^{-1}$", fontsize = 12)
plt.ylabel("Normalized intensity, a. u.", fontsize = 12)
plt.title("Fig. 1: the raw data",fontsize = 12,fontweight="bold")
This will give the image:
Rampy also provides a function to plot a spectrum, allowing an interactive view (leveraging Plotly) of the data and possibly of baselines and smoothed signals:
import rampy as rp
rp.plot_spectrum(spectrum[:,0],
                spectrum[:,1],
                xaxis_title="Raman shift, cm$^{-1}$",
                yaxis_title="Normalized intensity, a. u.",
                title="Fig. 1: the raw data")
See the Plotting page for details on the function.
Now you are ready for the next steps: Preprocessing